M8.3 OFFSHORE COQUIMBO, CHILE on September 16th 2015 at 22:54 UTC
Last update: 16 October 2015 at 09:47 UTC
Earthquake details | Aftershocks locations | Historical great regional earthquakes | Testimonies
Send us pictures or videos | Epicenter location
Earthquake details
A magnitude 8.3 earthquake hit northern Chile in the region of Coquimbo on September 16th, 2015 at 22:54 UTC (19:54 local time). More information on the main shock is available here.
A tsunami alert has been issue by the Pacific Tsunami Warning Centre. A tsunami hit Coquimbo and other costal villages with waves close to 4 meter high. According to the last reports, five people have been killed. Around 20 people have been reported injured. One million people have been evacuated from their homes after buildings swayed and collapsed in some areas.
This is the largest earthquake in Chile since the February 27, 2010 quake, that occurred 500 km further south and killed more than 500 people. The tremors has been felt as far as Buenos Aires, the capital of Argentina, more than 1,100 km away.
The main shock has been followed by numerous aftershocks: Within 4 days, 57 of magnitude above 5.0, 10 of magnitude labove 6.0 and one of magnitude above 7.0.
The spatial distribution of aftershocks suggests a 250-300km long rupture.
If you have experienced this earthquake, you are invited to answer the online questionnaire. Your testimony will be useful to update the Intensity map here below, where intensities correspond to the effects of the earthquake.
Aftershocks locations
 Loading, please wait...
|
|
|
| Aftershocks and population | Aftershocks and topography |
|
|
|
| Aftershocks time distribution | Aftershocks time rate |
Historical great regional earthquakes
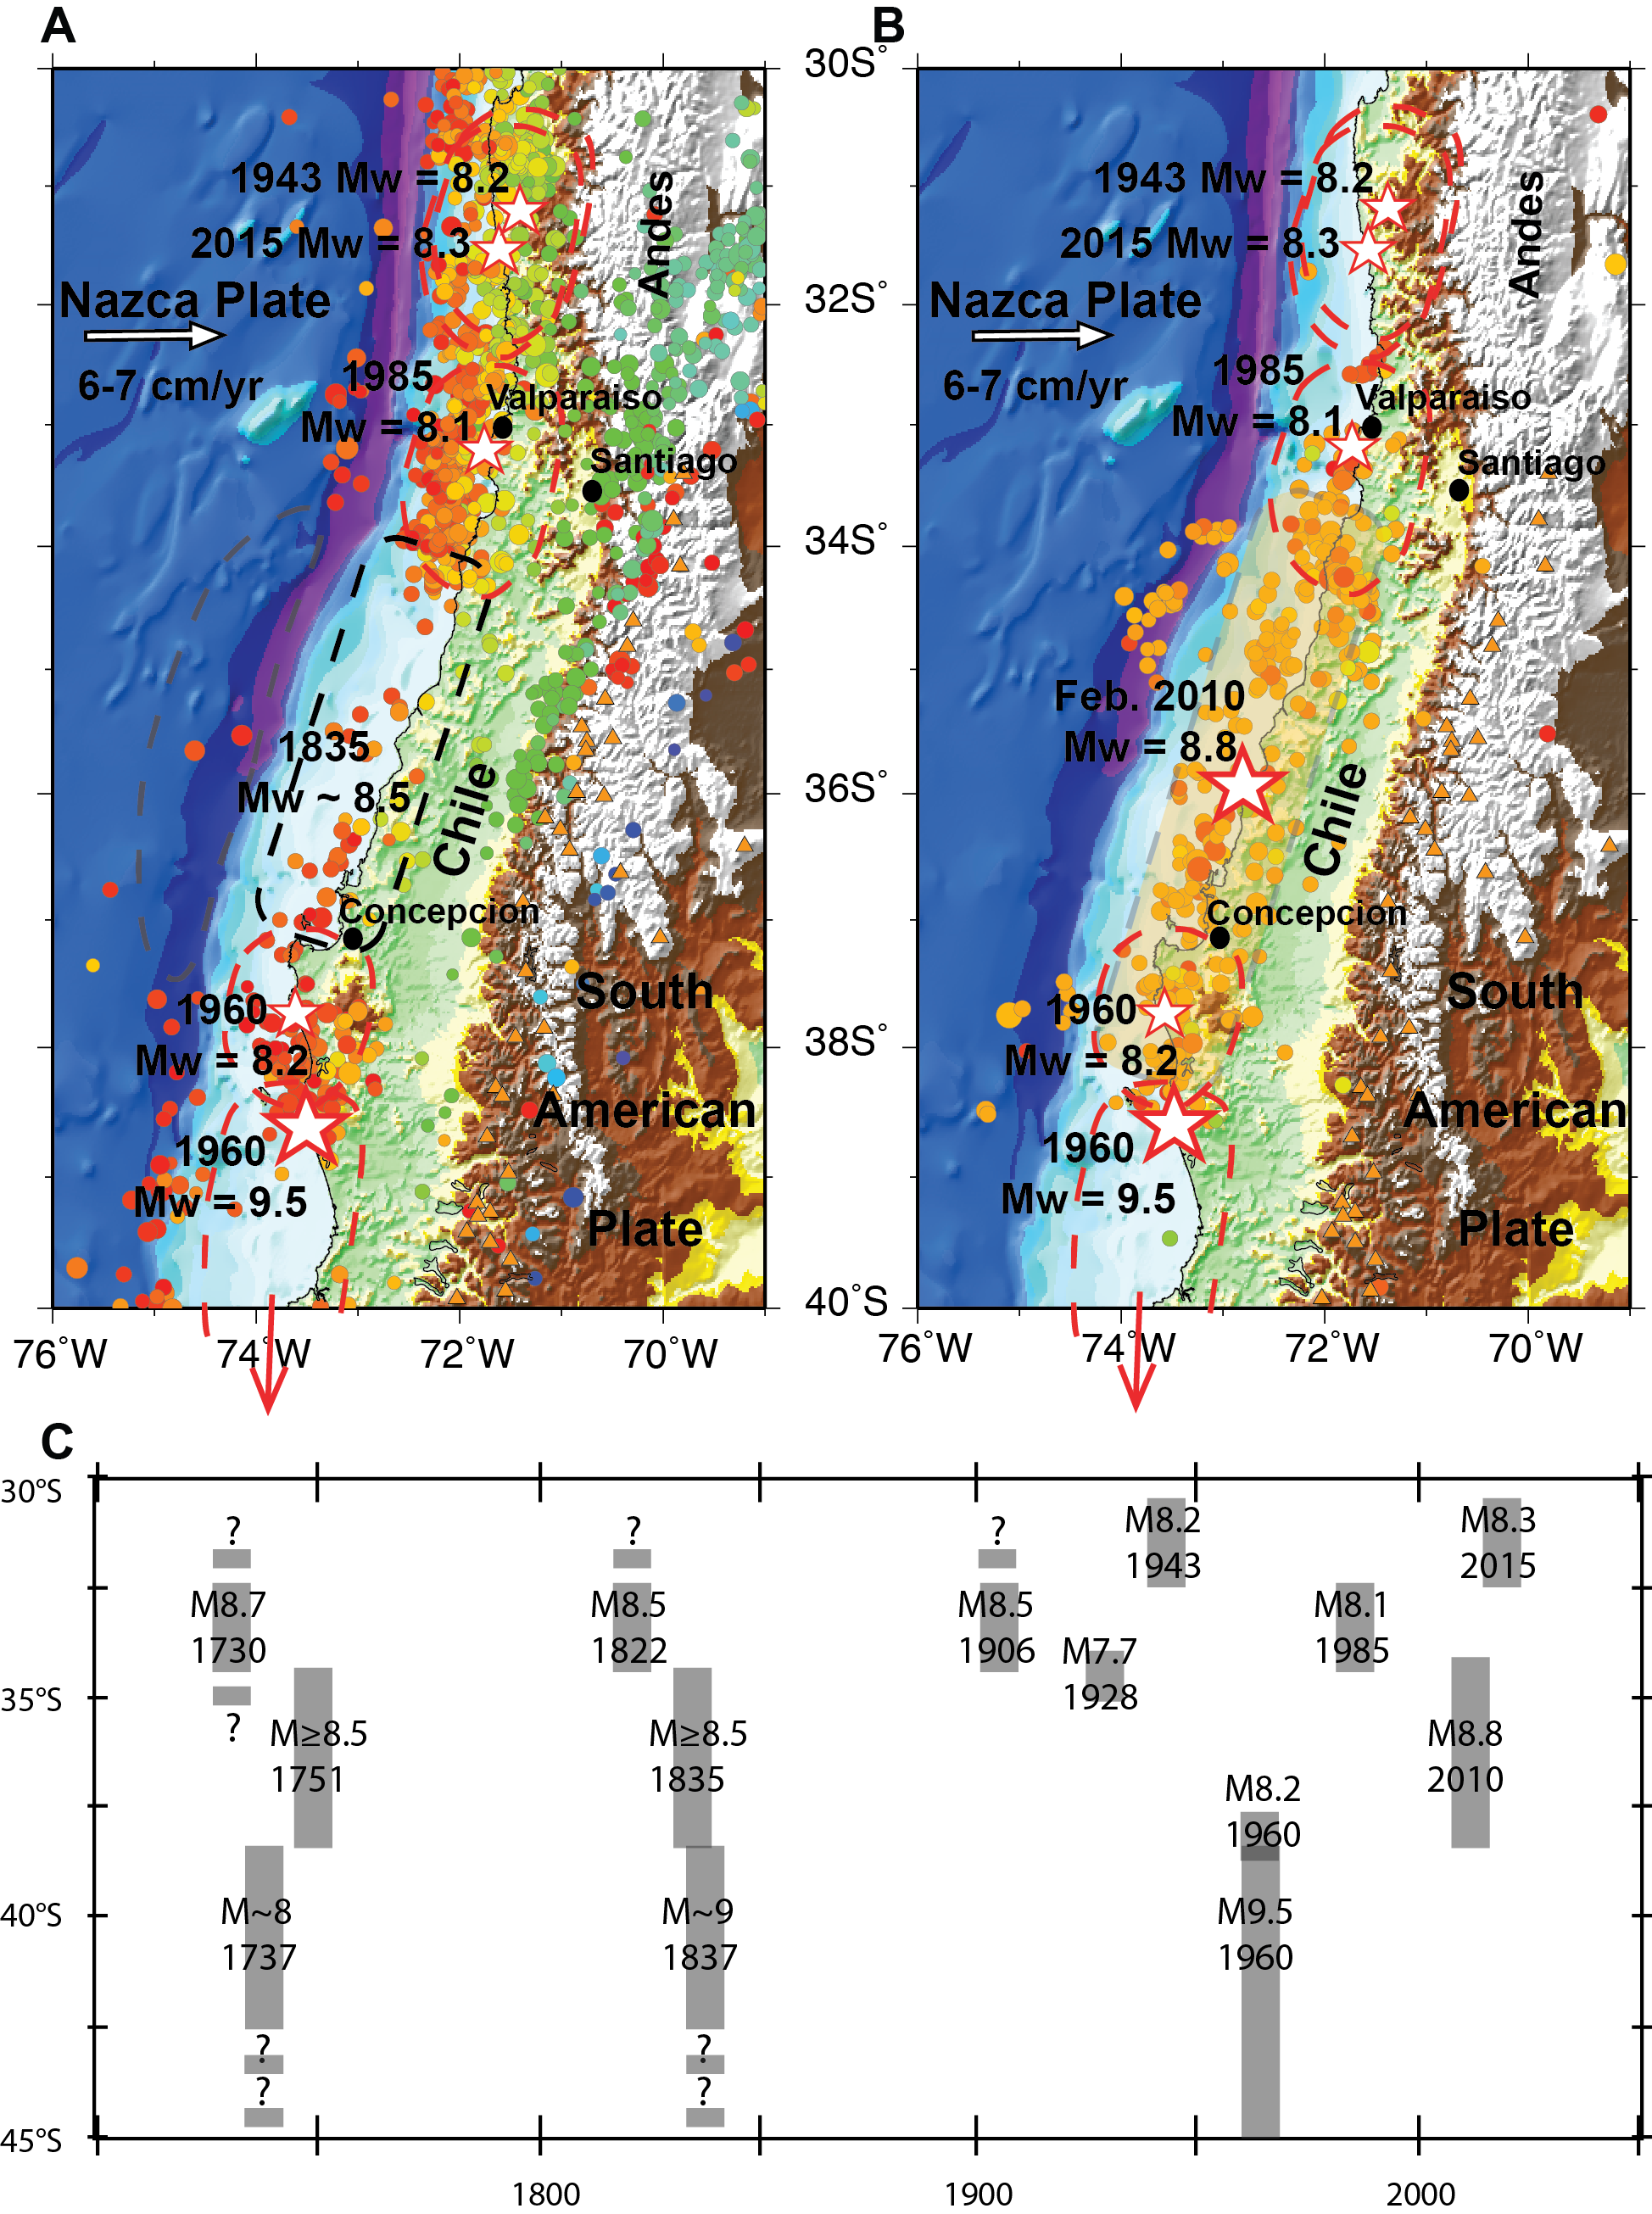
Figure: Chile subduction zone seismicity, A: EHB catalog (Engdahl et al., 1998; Engdahl and Villasenor, 2002), M≥4, 1 Jan. 1964 - 25 Dec. 2004 (post-1960 Valdivia, pre-2010 Maule), red stars indicate initial rupture of several great earthquakes (1943, 1960N, 1960S, 1985, 2015) with estimated rupture zones shown as dashed red lines, the approximate extent of the 1835 earthquake is shown as black dashed lines. The gray dashed line shows region outboard of the trench characterized by a nearly total absence of flexural bulge seismicity B: 2010 Maule M8.8 earthquake and 2-week aftershocks (27 Feb. - 12 Mar. 2010) M≥4, PDE Catalog. Red stars indicate initial rupture of great earthquakes with rupture zone boundaries dashed and also shaded light yellow for the 2010 event. Please note some post-event seismicity (north of 33.6°S) extends well into the 1985 rupture zone but is north of the co-seismic rupture zone, C: space-time distribution of great earthquakes along the Chile subduction margin from 1700 - 2015. (credits: M.-A. Gutscher; Institut Universitaire Europeen de la Mer, Brest, France)
Testimonies
Map generated with the results of the testimonies provided by eye-witnesses.
Internet Earthquake Detection and map of the felt area
When an earthquake is felt by the population, the eye-witnesses rush on the internet to find out the cause of the shaking. When they reach EMSC website, we automatically detect the surge of traffic, locate the eye-witnesses thanks to their IP adress and map the area where the earthquake was felt. This technique allows us to quickly detect felt earthquakes (within 1 or 2 minutes) and map the felt area before the first seismic data are available.
View the animation here: http://www.emsc-csem.org/Member/Felt_maps/felt_diapo.php?id=459672_VALIDATED
Send us pictures or videos
You were on the spot and you have taken photos or videos of earthquake effects (on buildings, ground, landscape), please send us your files. Send them by mail or upload them directly from your computer. Just click on the link below :
Send us pictures or videos of the main shock effects
After validation your files will be displayed on this page.
Epicenter location
 Main Shock Epicenter Location |
 Past Regional Seismicity as from the ISC catalogue (1964-2004) and EMSC Real Time catalogue (2005-today) |
 Moment Tensors Solutions |

