Mw 8.8 Off Shore Maule, Chile on 27/02/2010 at 06:34 UTC
An earthquake of magnitude Mw 8.8 occurred on 27/02/2010 Off Shore Maule, Chile at 06:34 UTC (03:34 local time) about 115km north-east of the city of Concepcion and 325km south-west of the capital, Santiago. More information on the main shock is available here.
This earthquake occurred at the boundary between the Nazca and South American tectonic plates. The two plates are converging at a rate of 80 mm per year. The earthquake occurred as thrust-faulting on the interface between the two plates, with the Nazca plate moving down and landward below the South American plate.
The Feb 27th earthquake is the largest earthquake in the region since the Valdivia earthquake (Mw 9.5 on 22/05/1960) which occurred 230 km further south. It is also one of the largest of the last hundred years.
As on March 1st, the quake has already killed 700 people in mainland Chile, many of them near the city of Concepcion.
The tsunami generated by the earthquake created waves of 2.3 meters on the Chilian coast (Talcahuano). The archipelago of Juan Fernandez, 700km off the coast of Chile, was strongly damaged. The Marquises Islands have been affected by several waves of 2 to 4m high. After crossing the Pacific ocean, waves of 120cm were reported in Japan, causing coastal floods. The alert systems in place provided information for the evacuation of the population in several regions, in the coastal areas on Easter Island as well as Samoa and American Samoa, and as far as Japan.
On March 1st, the tsunami warning has been cancelled by the PTWC.
More Information:
- Recent earthquakes in Chile: Universidad de Chile
- Tsunami information: Pacific Tsunami Warning Center
- U.S. Geological Survey web site
- Fast teleseismic body-wavesource inversion (by Martin Vallee; Geoazur, Nice, France)
- Status on scientific information (by Christophe Vigny; ENS, Paris, France for LIA Montessus de Ballore)
- SUB-CHILI Project, franco-chilian collaboration (in french)
- Tsunami travel time map (NOAA)
- Source preliminary analysis (USGS)
- Coulomb stress maps for optimal planes to regional compression (by Ganas and Batsi; Athens, Greece)
- IRSN information note on the event
- The Earth eigenmodes excited by the Chilean earthquake (by van Camp and Rivera; ROB and EOST, Belgium and France)
- Scientific Issues (CEA in french)
Aftershocks locations
The rupture zone shows a bilateral pattern with a distribution of aftershock along a 600 km long area.
 Loading, please wait...
Aftershocks locations until 05/03/2010 08:00 UTC.
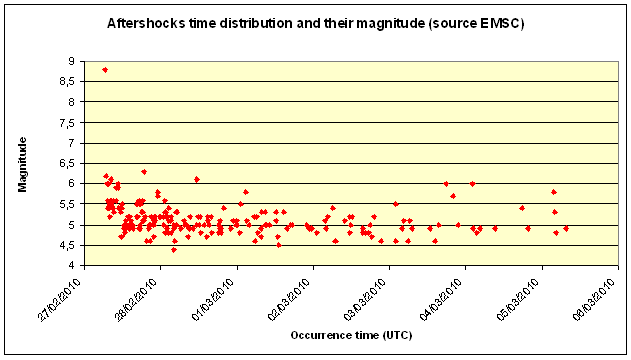
Aftershocks time distribution

Aftershocks time distribution until 05/03/2010 08:00 UTC.
The number of aftershocks and their magnitude decrease with time. Until 05/03/2010 08:00 UTC, 205 aftershocks of magnitude larger than 4.4 have been recorded by EMSC. They correspond to 64 recorded aftershocks of magnitude 4.0-4.9 (more events of this magnitude range have occurred but have not been recorded at long distances), 131 aftershocks of magnitude 5.0-5.9 and 10 of magnitude larger than 6.0.
Tectonic settings
The 27 Feb. 2010 earthquake is the fifth strongest of the past 100 years (after Chili/Valdivia 1960 M9,5; Alaska 1964 M9,2, Sumatra/Andman 2004 M9,1; Kamchatka 1954 M9,0). Just like these other earthquakes it occured in a "subduction zone" tectonic setting and was caused by an oceanic plate thrusting beneath a continental plate.
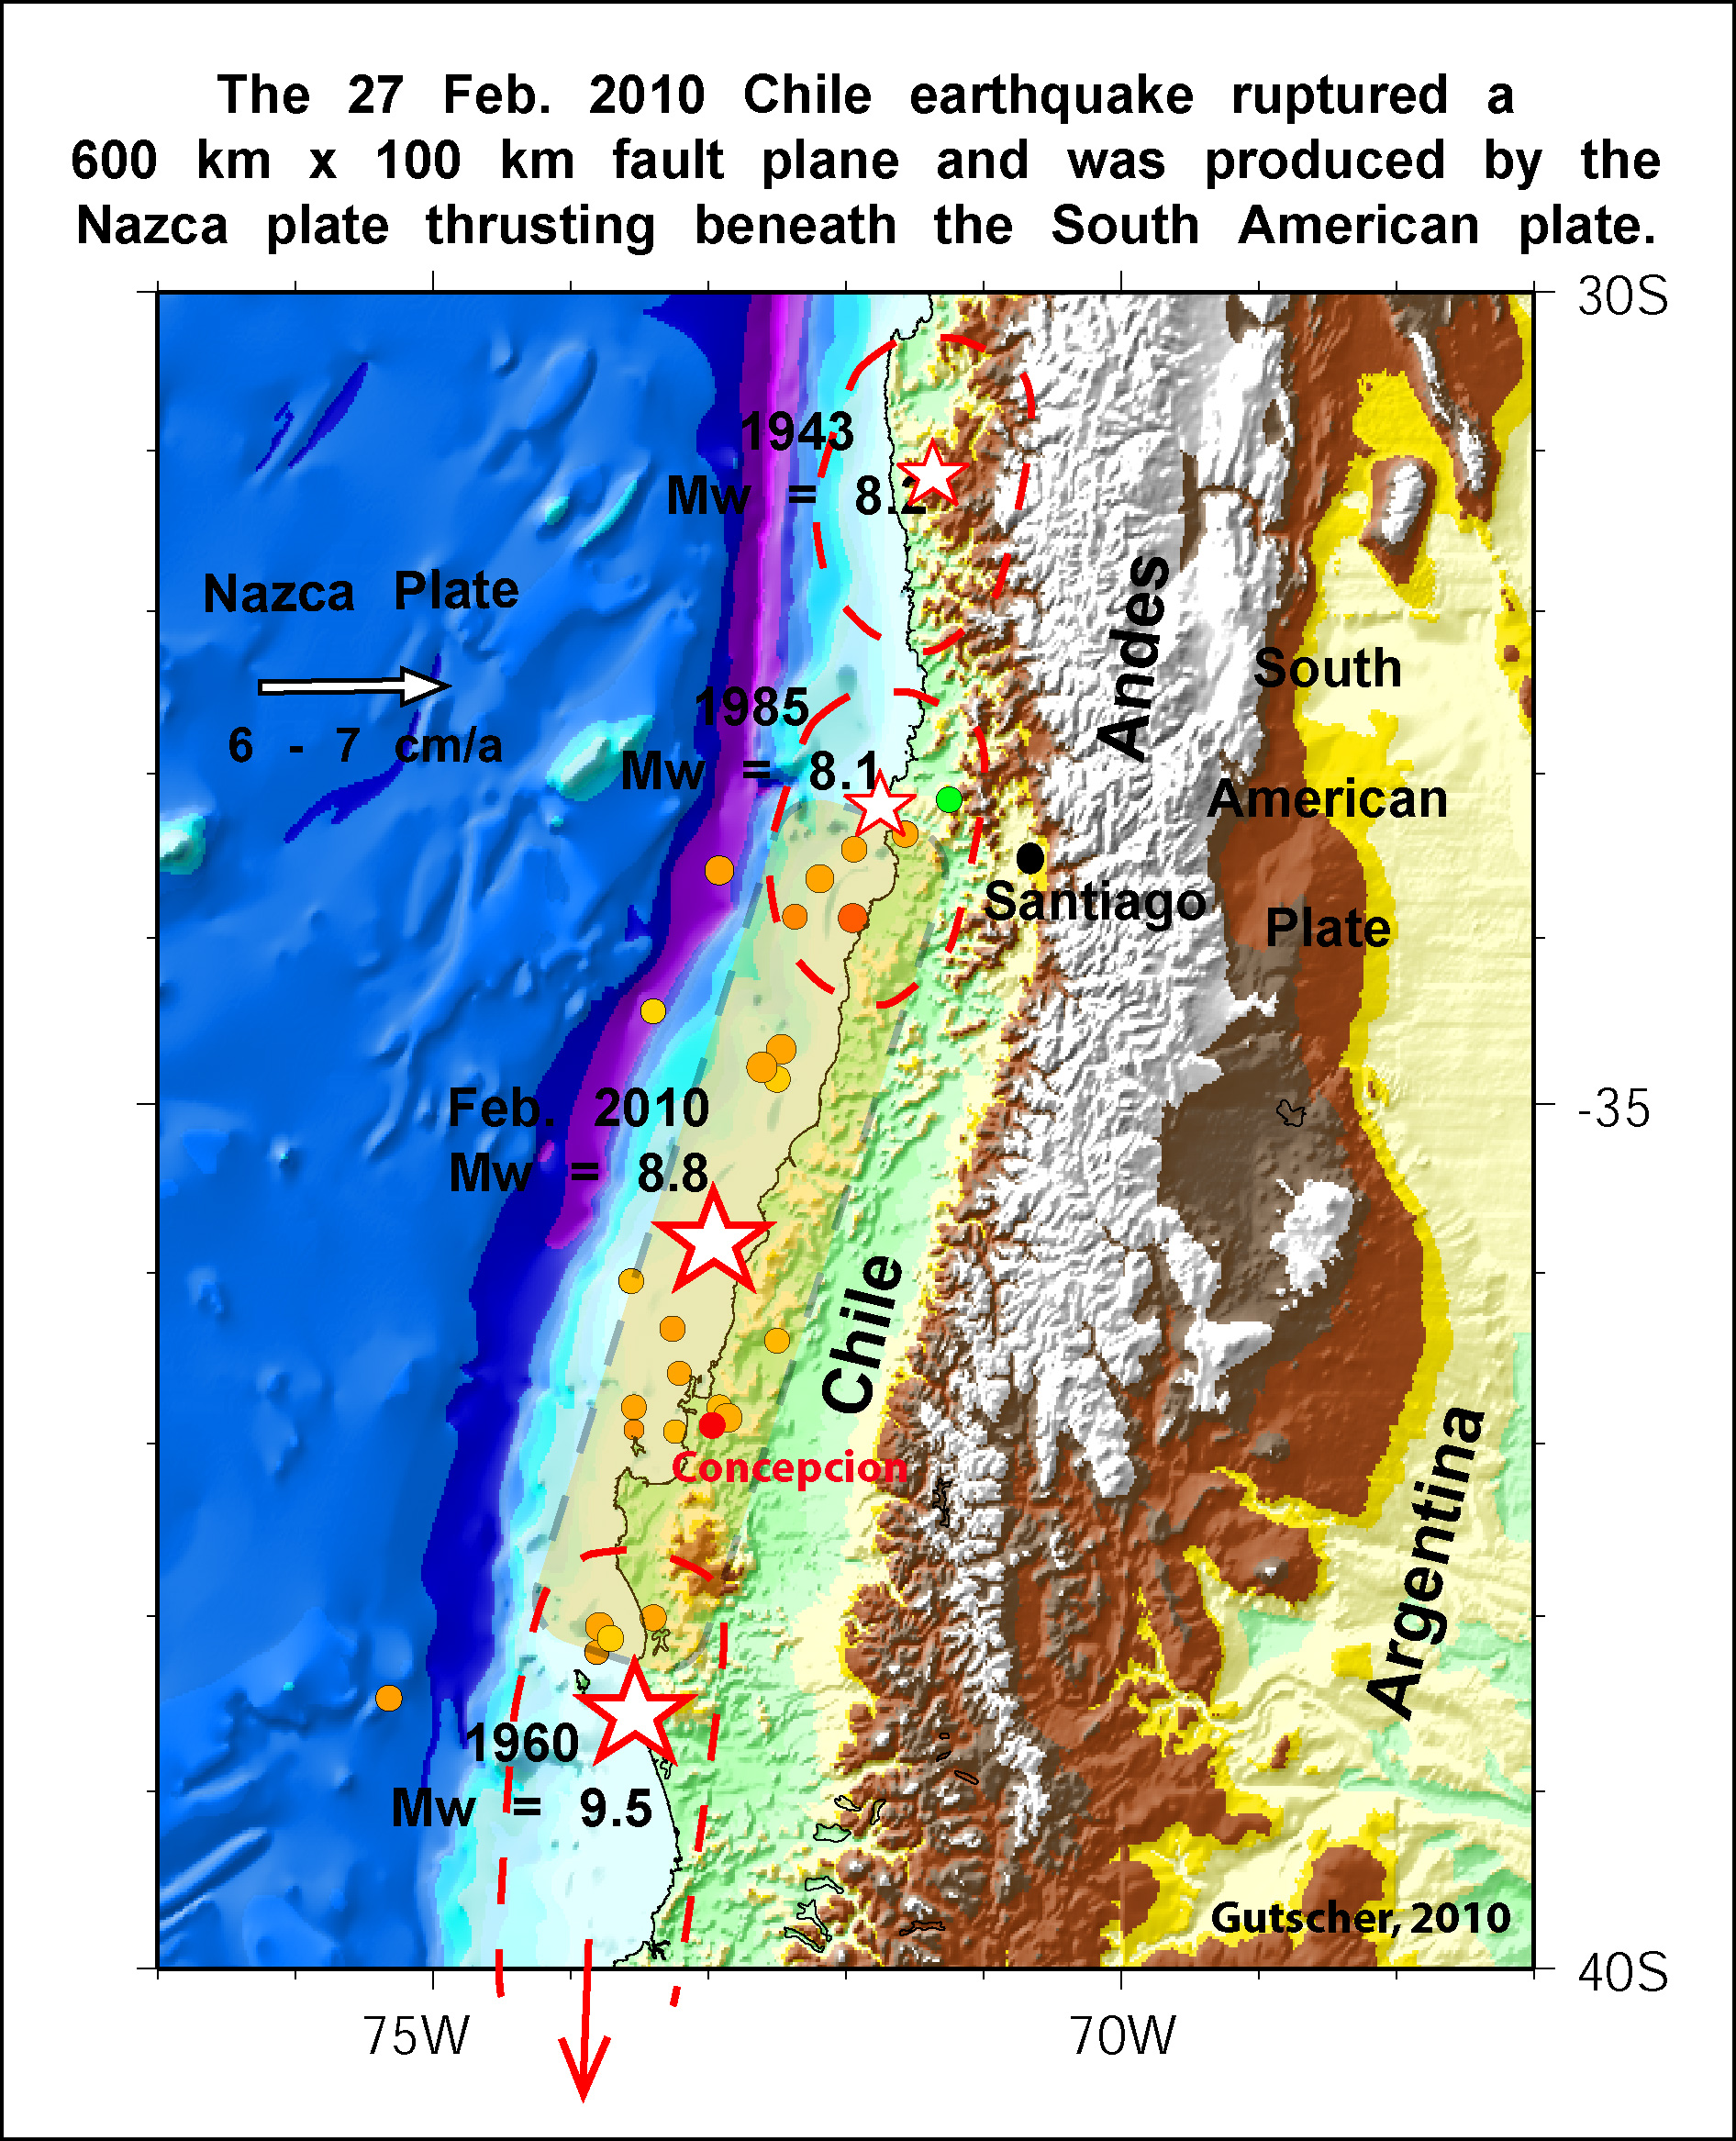
The map (below) shows the aftershocks during the first 6 hrs (yellow circles) and the likely extent of the rupture zone (transparent yellow shading) with approximate dimensions of 100km (E-W) by 600 km (N-S).
The ruptures zones of other great earthquakes to have struck this portion of the Chilean margin during the past 60 years are also shown.Most of the segment which caused the Feb. 2010 earthquake had not experienced a major event in several decades. Indeed, the last great earthquake occured here in 1835 and was described by Charles Darwin. These observations suggest a mean recurrence time between great earthquakes on the order of 150-200 years. (Marc Andre Gutscher; Institut Europeen de la Mer, Brest, France)

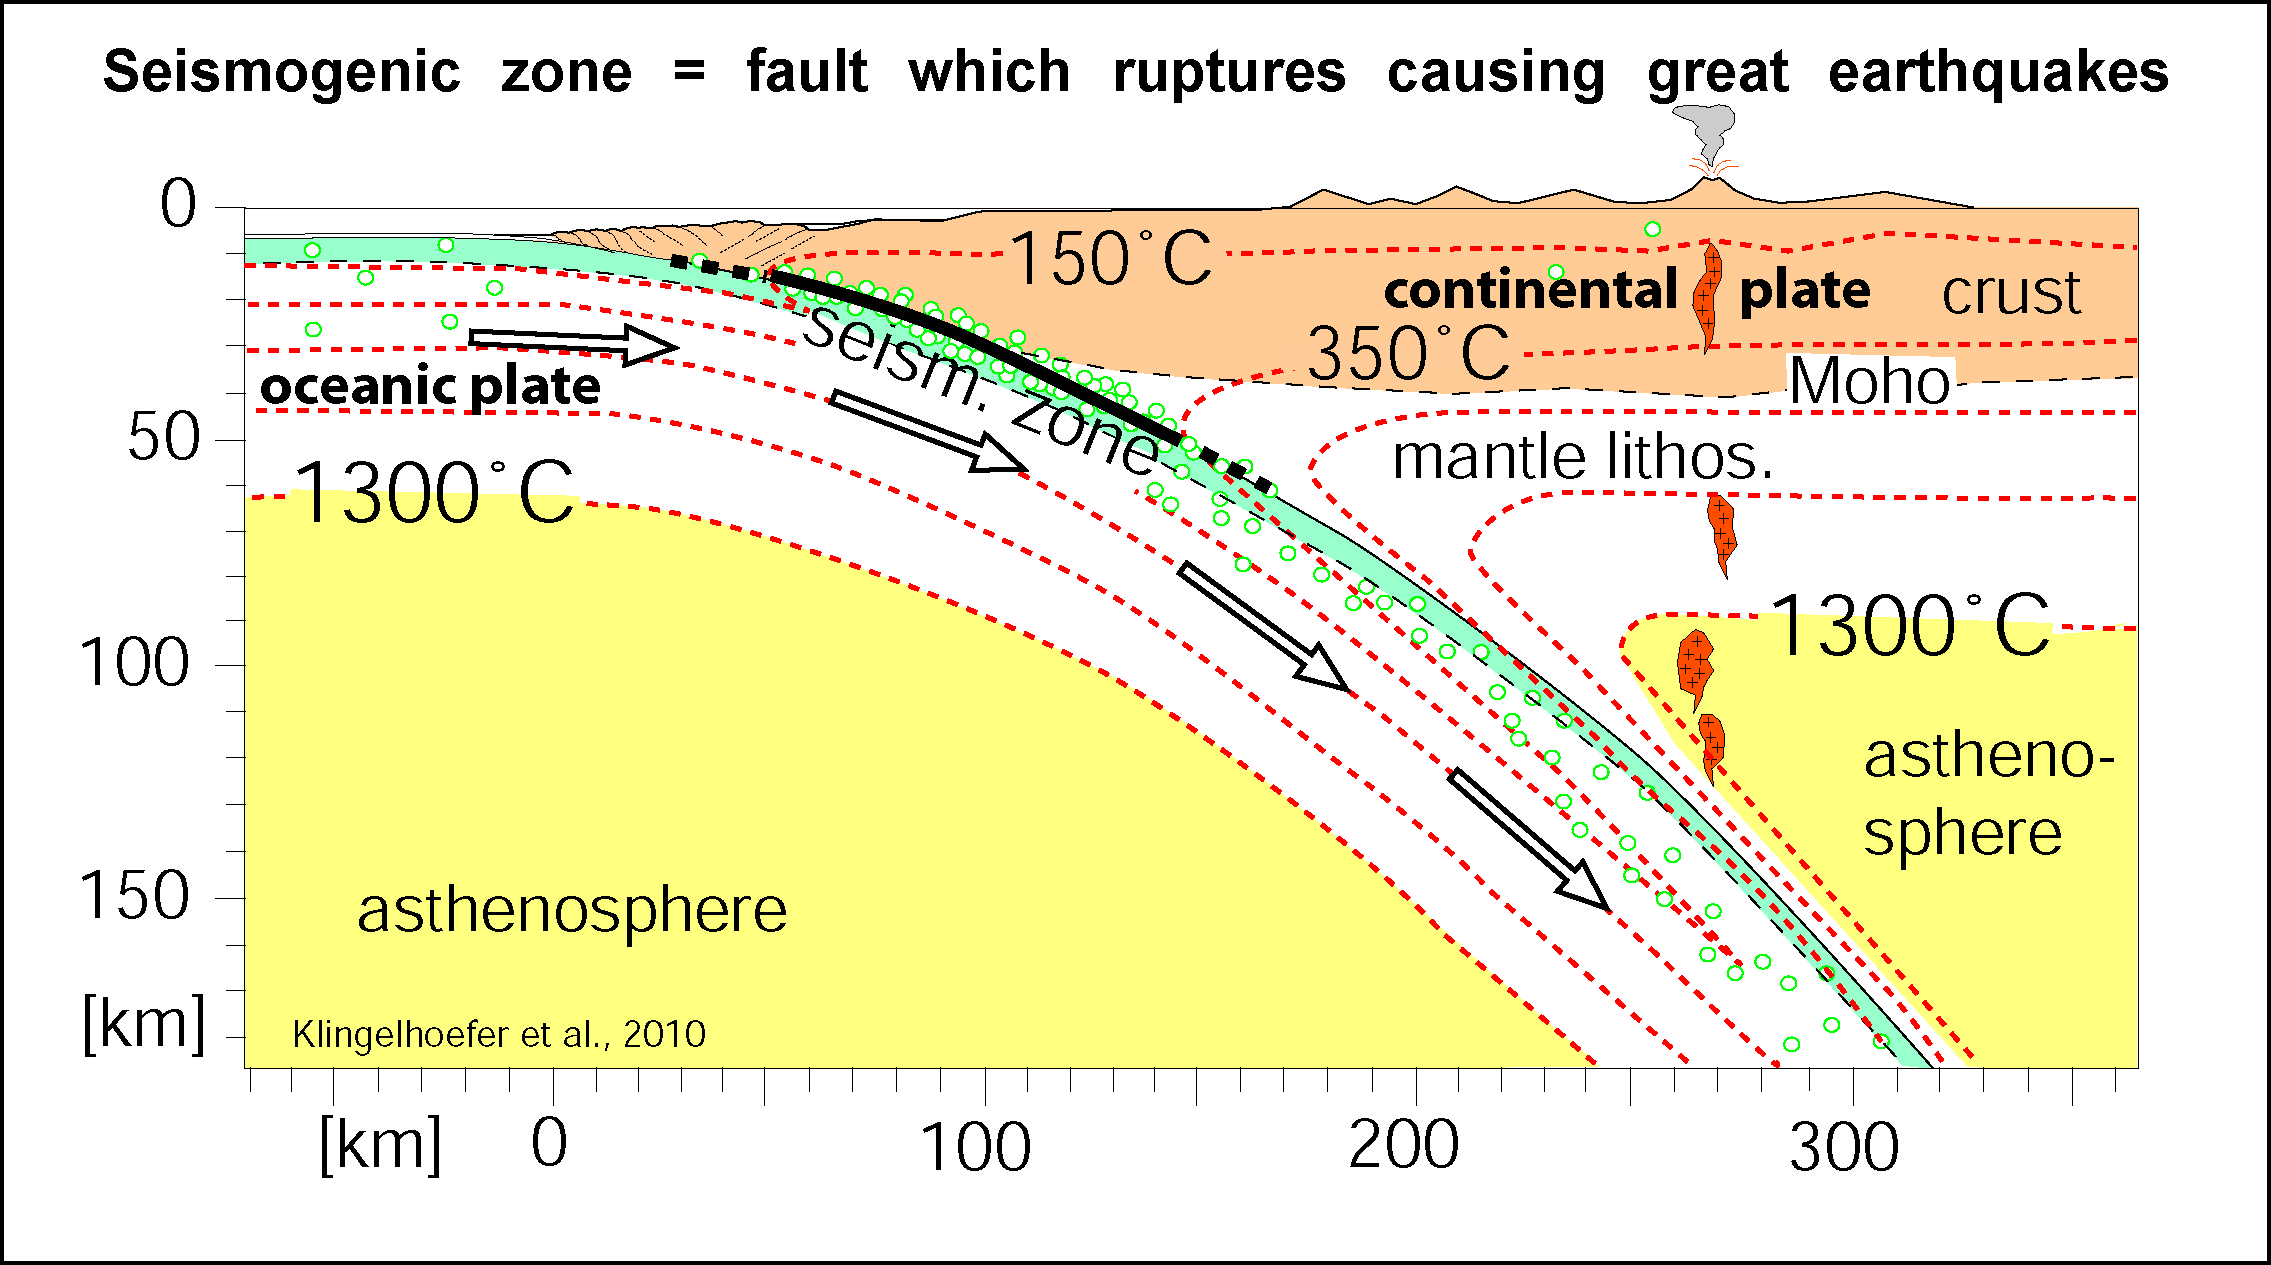
The schematic diagram shows below an idealized cross-section through a subductionzone, with the oceanic plate (at the left) underthrusting a continental plate (on the right). The small green circles represent earthquakes (mostly of small magnitude). Great earthquakes are generated along the "seismogenic zone" where the motion between the two plates is blocked over an extended period of time (typically decades to centuries). When this accumulated slip (up to several meters) is released suddenly, a giant earthquake occurs. The seismogenic zone commonly extends from roughly 10km depth to approximately 40km (or more) in depth and in most cases is thought to be situated within a temperature range from about 150 to 350 degrees. (Figure modified after Klingelhoefer, Gutscher, et al., JGR, Jan. 2010).

Answer our questionnaireIf you have experienced this earthquake, you are invited to answer the online questionnaire.Your testimony will be useful to update our Macroseismic map (on the right) which maps the effects of the earthquake. View the results of the questionnaires  View the comments posted in the questionnaires |
 |
Send us pictures or videosIf you were in the area and have taken photos or videos of earthquake effects (on buildings, ground, landscape), please send us your files. You can send them by email, MMS or upload them directly from your computer. Just click on the link below :Send us pictures or videos of the main shock effects |
Epicenter location and regional seismicity
 Main Shock Epicenter Location |
 Past Regional Seismicity as from the ISC catalogue (1964-2004) and EMSC Real Time catalogue (2005-today) |
 Moment Tensors Solutions |